Module 14: Visualize and Analyze Data
This module focused on adding R and Python visuals to a report and using PBIDS files to manage data source connections in a reusable way.
Adding R and Python visuals
Power BI can use both R and Python to create custom visuals, but there are some important requirements before they will work.
Python visuals
Python visuals in Power BI allow you to use Python scripts to transform data and create custom visuals. In order for this to work, Python must be installed on the machine running Power BI Desktop. You also need to enable Python scripting in the Power BI settings.
A basic workflow is:
- Add the Python visual to the report canvas.
- Select the fields you want to use.
- Power BI passes the selected data into a Python script.
- The script processes the data and returns a result.
- The visual displays the output in the report.
This is useful when you want more advanced statistical analysis, custom charts, or visualizations that are not built into the default Power BI visuals.
R visuals
R visuals work in a similar way, but they require an R engine to be installed and configured on the machine. If Power BI cannot find an R installation, the visual will not run.
The process is:
- Add the R visual to the report.
- Choose the fields you want to use.
- Write the R script.
- Run the script and let Power BI render the output.
R is especially useful for advanced analytics, statistical modeling, and custom visual creation. It gives you more flexibility than the standard built-in visuals, but it also requires a bit more setup and knowledge.
One key point is that you are not just writing a regular report chart. You are using a script-based visual where the data is passed into R or Python, and the resulting output is rendered back into Power BI.
Using a PBIDS file
A PBIDS file is a Power BI Data Source file. It is a small configuration file that stores connection information for a data source, such as the server name, database name, and connection details.
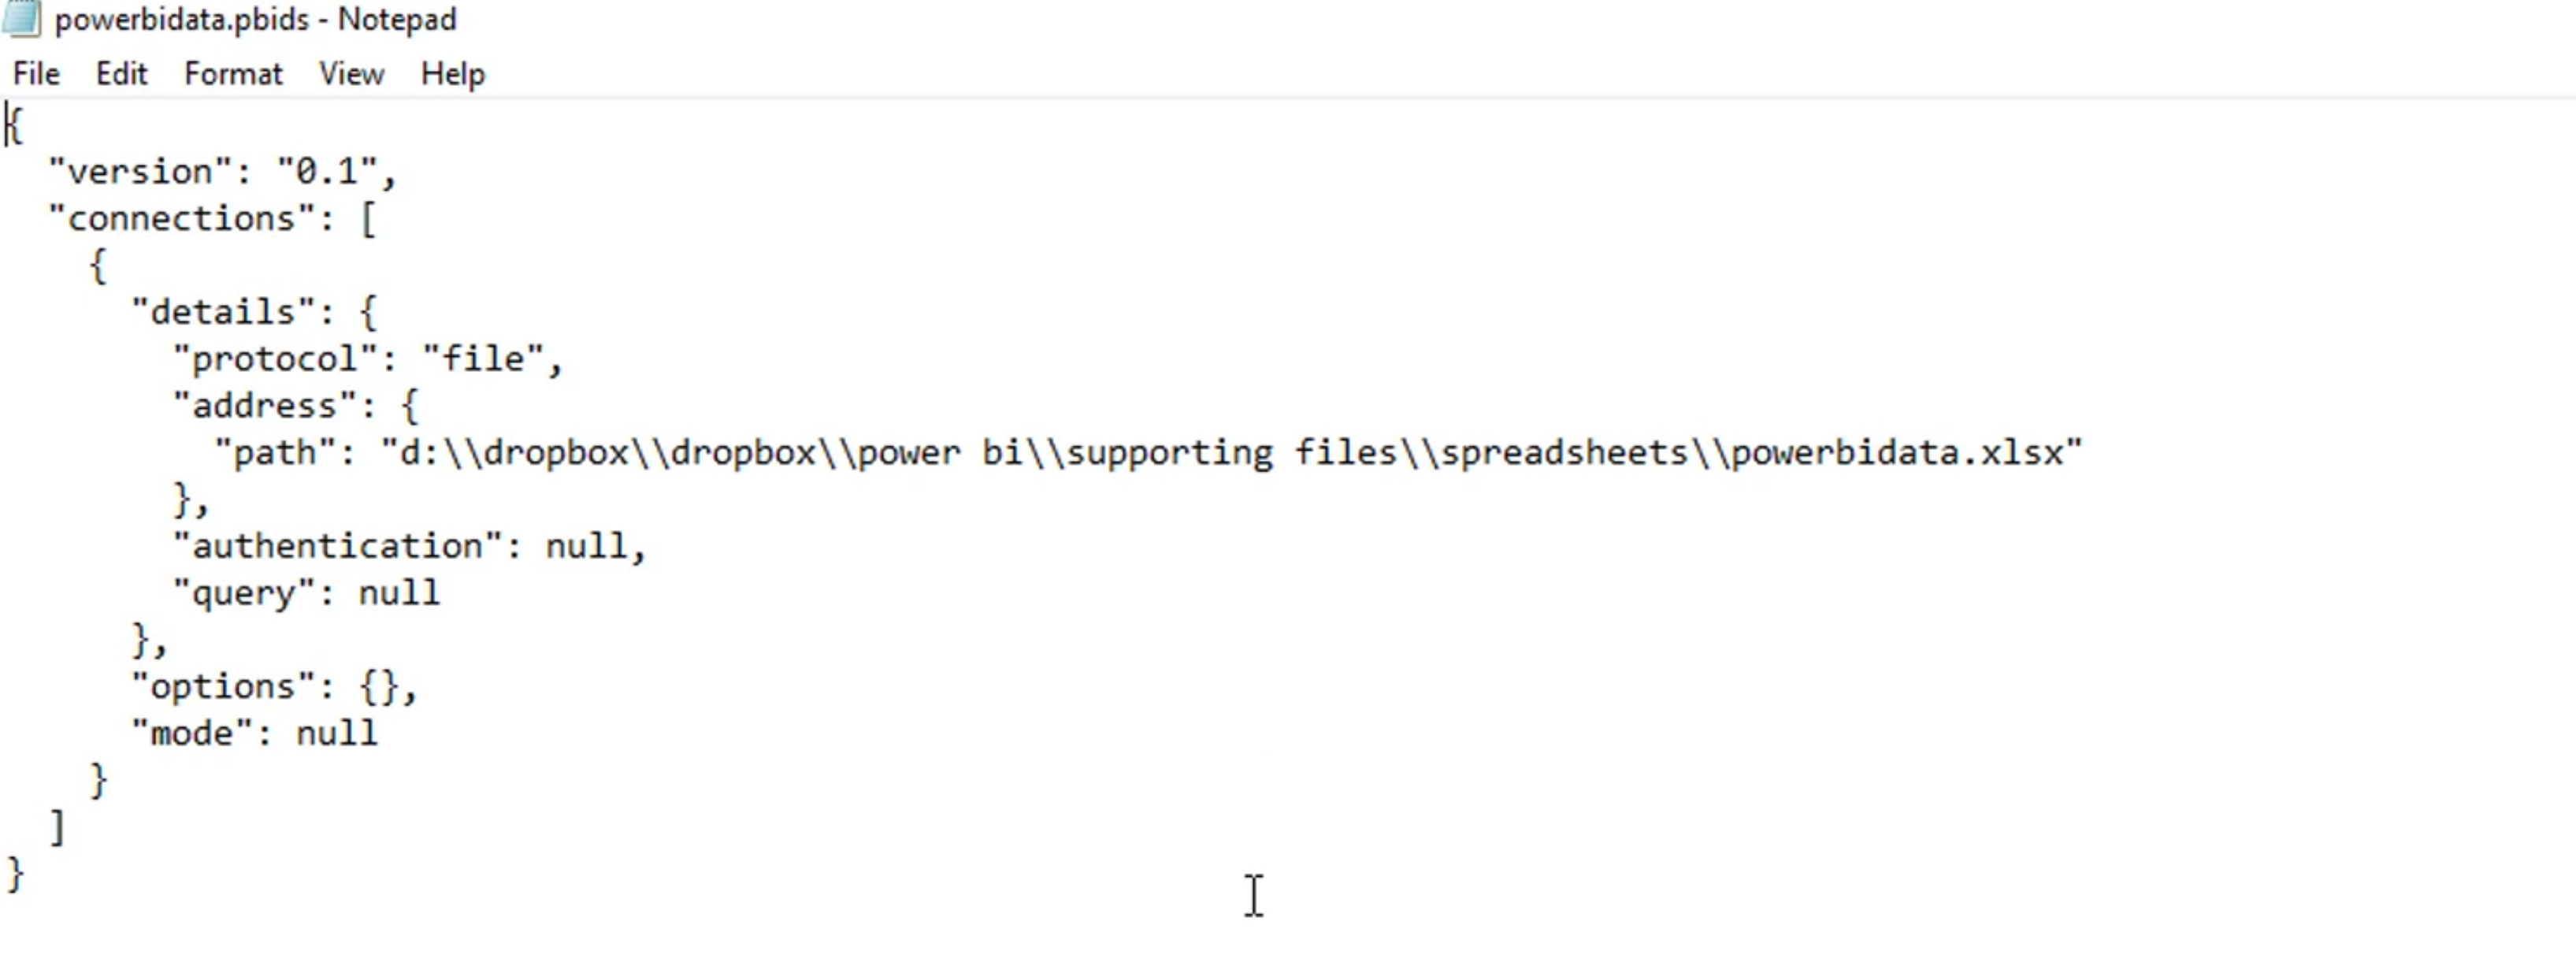
The benefit of a PBIDS file is that you can reuse the same data source connection across reports without re-entering the connection details each time. This makes it easier to standardize connections and keep report setup consistent.
In simple terms, a PBIDS file is like a saved connection definition. It tells Power BI where the data source is and how to connect to it.
Summary
Python and R visuals both rely on a script engine being installed and available in Power BI.
- Python visuals require Python on the machine.
- R visuals require an R engine on the machine.
- Both can be used to create custom, script-based visuals in reports.
- A PBIDS file stores the connection details for a data source so it can be reused.
- PBIDS is a reusable connection definition rather than a full report or dataset.
This is a quick overview of how Power BI supports script-based visuals and reusable data source definitions.